
Exploring the Future of Business Intelligence
Geneva Business News recently had the opportunity to speak with Pascal Rodriguez, Partner and Engineering Director at Visium,... En lire plus

For any organization, business intelligence is the key. It helps everyone - regardless of job, title, or sector - work with, and understand, various forms of data. This enables better, quicker, smarter decision-making.
So what is Business Intelligence? Well, let me show you.
At 330 metres (1,083 ft), the Eiffel Tower is a tall iron structure with a lattice pattern. It is the height of an 81-storey building. An iconic symbol of Paris, it weighs over 10,000 tons, or some 7,000 cars, or 1.0 × 10^8 bananas. Its square base measures 125 metres (410 ft) on each side.
Or, focus on this image:

Which information was more effective and catchier for you to understand? The answer is visualization.
Business Intelligence (BI) is a tool to help organize and analyze data, turning it into useful insights and trends.
Imagine you have a big puzzle box with hundreds of small puzzle pieces. Each piece represents a tiny piece of information. But when you open the box and put them on a table, it is just a big complex mess, right?
What if you have a paper inside it showing how these puzzles should look when completed? Now these little pieces of information suddenly make sense.
Business intelligence (BI) is like having these little pieces of paper for a company or business. Instead of puzzle pieces, it is about organizing the different pieces of information a company collects (for example, sales numbers, budget, employee details, or project information).
Just as the puzzle paper helps you see the whole picture, BI helps put these pieces together correctly so that businesses can see the full picture of what's happening quickly and effectively. It is like having a special tool to unlock the secrets hidden in all those puzzle pieces!
Business Intelligence helps companies understand what is going well, what needs improvement, and how they can make smarter decisions to succeed.
BI mainly helps the Heads of Departments, Human Resources, Project Managers and Team Leads.
Do you need technical knowledge to understand BI visuals? No!
See the sample Excel tables below showing employees' time in the office.
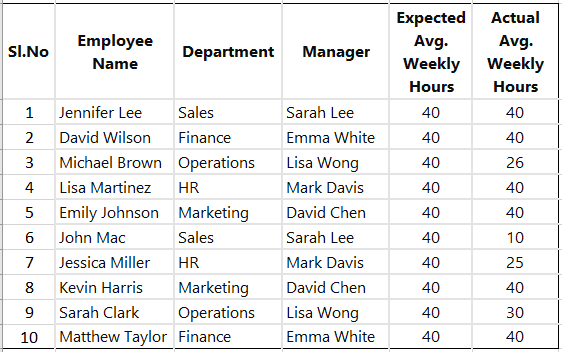 |
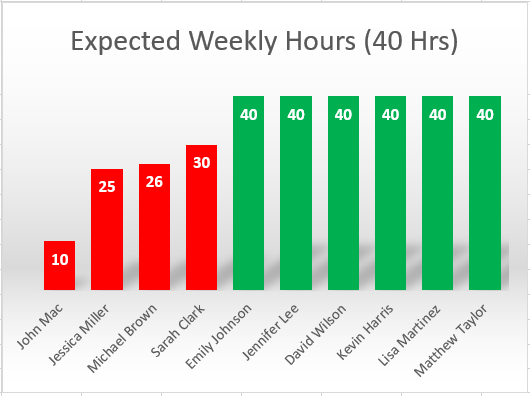 |
Well, John Mac is in a tough spot. And unfortunately for him, you can see it easily in the bar graph on the right!
So if Excel can sort and generate graphs, why the need for a specialised BI tool? Well for this 10-row data, basic sorting can do the job.
But what if you have a huge amount of data with hundreds or thousands of data points? Excel has as limitations when it comes to handling large volumes of complex data and generating meaningful insights quickly.
That is when BI comes into its own.
Let's look at some of the advantages of BI for understanding data.
Overall Excel is a versatile tool for basic data analysis but BI tools offer more powerful capabilities for organizations that need to manage, analyze, and derive insights from large and diverse datasets. Complex data can be interpreted easily and clearly with powerful BI tools.
Now wondering how to impprove BI in an organiastion? It involves several steps. Briefly, they are:
Let Business Intelligence transform your decision-making. Because we human beings are naturally inclined towards visuals over lengthy text. Our brains are wired to process images more efficiently and quickly absorb information presented in visual formats compared to long blocks of text.
Further reading:
Top 10 Skills for Business Intelligence Analysts
Image: depositphotos, Canva

I am a Business Intelligence and IT expert skilled in transforming complex data into simplified, actionable insights, such as the award-winning Gender Parity dashboard I developed for the International Trade Centre. My proficiency in data analysis and visualization enhances decision-making and operational efficiency across diverse international settings. My technical expertise, combined with strong communication and project management skills, make me a versatile asset in any data-driven organizational role.